
The internal combustion engine (ICE) has reigned supreme for over 100 years, but prognosticators are predicting its demise over the next few decades – or NOT, depending on your data analytics. Like all technologies, sooner or later a disruptive replacement comes along and renders the status quo extinct. Will electric vehicle (EV) technology be the disruption that kills the ICE? I think so, but the future of EV transportation is not guaranteed.
Sales of plug-in electric cars amounted to barely 1% of total US sales in 2016, prompting many forecasters to doubt the inevitability of electric cars. Still, Tesla Motors has 373,000 pre-paid orders for its next generation vehicle to be built in 2017 and beyond, suggesting a tectonic shift may be afoot. Let us assume all non-ICE based automobiles implement some form of EV technology, e.g. hydrogen, flywheel, battery powered cars will all depend on an electric motor rather than an ICE. Therefore, the availability of non-ICE, i.e., EV vehicles, may be several times larger than the availability of Tesla Model 3 vehicles and beyond.
Combining all forms of non_ICE based transportation into the EV category may provide a bigger picture of the future of ICE based vehicles and answer the question of whether EV technology will ever replace ICE technology. This is a chance to exercise your technology adoption forecasting abilities. If the reader is not already familiar with Frank Bass’s forecasting model, I recommend his web site: http://www.bassbasement.org/BassModel/.
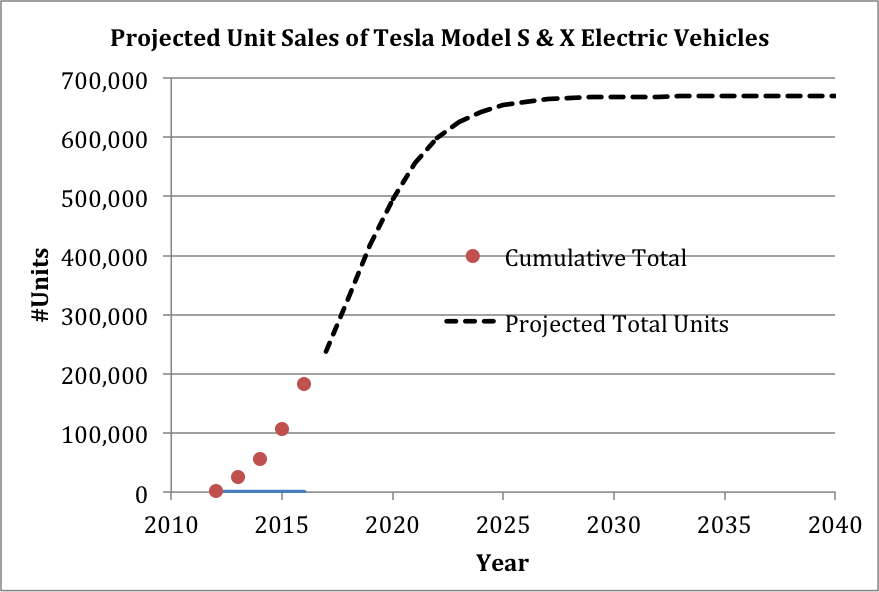 Figure 1. Sales of Tesla Model S and X cars reach a peak of 670,000 units in about ten years.
 Figure 2. Global car production based in 1999-2011 sales grows linearly with time and is expected to rise from 72 million in 2016 to 140 million in 2050.
Tesla is not enough
The Bass model for sales of Tesla electric vehicles shown Figure 1 suggests a peak total of N = 670,000 vehicles reached within the next decade. This projection is based on a rather small data set because Tesla has been selling cars for less than five years. Furthermore, it is based on the Model S and X, both vehicles are premium priced, which limits the available market. Nonetheless, it provides a starting point to begin the following analysis.
We must find three parameters to fit the Bass equation to actual data. Parameters p, q, and N are obtained by curve-fitting a quadratic to DF/dt vs. F(t), where F(t) is cumulative sales in units, and DF/dt is the annual sales rate in units/year. The values of p, q, and N are obtained from the coefficients of the least-squares quadratic equation, DF/dt = A + BF(t)+CF(t)2. Parameter q/p determines the height of the S-shaped adoption curve and (p+q) determines the slope of the exponential part of the adoption cure, see Figure 1. The results of Figure 1 suggests a leveling out of sales far below what is needed to overcome the rate of production of all cars, including ICE based cars. Even if we include all sales of all EVs since 2012, Bass’s equation does not provide enough “lift” for EV liftoff, because of Figure 2.
Figure 2 summarizes global production of all cars now and into the future using simple regression. By the time (2025) Tesla reaches .7 million units, global production of all cars will reach 90 million per year. In other words, Tesla’s electric car production will not exceed one percent of the total ~ a level enjoyed by all electric car producers combined in 2017. It seems as though EV production can never reach critical mass compared with ICE production, unless EV production accelerates much faster than it has thus far.
Tesla is expected to create 10x demand for its less expensive Model 3. Hence, it is reasonable to assume the next generation of electrics from Tesla can reach a level ten times the projected level of Figure 1. Assuming other automobile manufacturers combined equal Tesla’s production numbers, by 2025 we can expect 14 million of the 90 million cars to be electrics. That is 16% penetration in a decade. This is still not enough to kill the ICE and transform personal transportation.
In addition, EV production and consumer adoption is partly motivated by government subsidies, currently amounting to $10,000 in California. What happens when these subsidies are eliminated? Finally, the rise of Uber and Lyft raise the possibility of ride-sharing in place of owning a car. If ride-sharing expands fast enough, might both EV and ICE based production dwindle? These policy impacts are unpredictable. We can only make projections from actual data known today, and make reasonable assumptions about tomorrow.
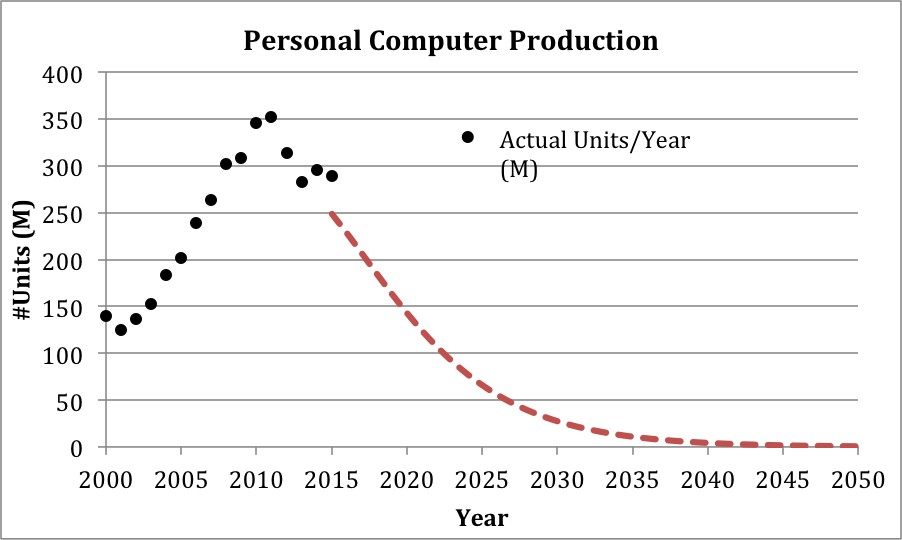 Figure 3. Personal Computer production reached a peak in 2010 and then began a slow decline as adoption of smartphones and tablets increased.
 Figure 4. Electric vehicle replacement of ICE under PC-growth assumptions suggests a slow adoption period reaching beyond 2050.
Slow adoption
Figure 4 is an attempt to answer the question, “when will EVs replace ICE cars, if ever?” The answer depends on assumptions about replacement rates and the adoption of EV technology throughout the automobile industry. Figure 3 is a Bass model of global PC production and adoption since 2000 with forecasts beyond 2015. Bass parameters p = 9.52E-4, q = 1.9E-1, and N = 6E+6 (in millions) were obtained from PC production models and applied to EV production as shown in Figure 4. Total automobile production was modeled by extending the linear fit of Figure 2 to global production into the year 2050. The resulting model assumes EV adoption rates equal to PC adoptions over the past 40 years. This is a reasonable assumption only if you believe EV adoption is similar to PC adoption in the past.
The Bass model of PC production shows a decline in PC production as mobile devices and other IoT (Internet of Things) devices replace desktop and laptop PCs. Regardless, we can obtain the three Bass equation parameters from the declining PC production model. The combined Bass model of EVs (based on PC production parameters p, q, but with N = 72 million) and linear rates of total car production produce an expected decline in ICE car production spanning the next 35 years. Soon after 2050 the number of EVs produced will equal the number of ICE cars produced, but the projection does not eliminate ICE production entirely. I call this the slow adoption rate scenario.
 Figure 5. Fast adoption assumes EV production capacity matches total demand of 120 million units by 2040, and consumers switch to EVs.
Fast adoption
A second scenario called fast adoption accelerates both demand and production of EVs to the limit. Here the adoption rates of the PC are used for EV adoptions but N = 240 million instead of 72 million. This represents an aggressive rate of increase in both demand and production capacity for EVs over ICEs. Production levels cross by approximately 2034 (17 years from now), and ICE automobiles become extinct soon afterwards, by 2040.
The fast adoption scenario may seem unrealistic, but consider the following fast adoptions from the past, reaching 40% of the available market within 20 years: radio, TV, cell phone, tablet computers, Internet, and desktop PC.
Reality is perhaps somewhere in between slow and fast adoption.
References
https://en.wikipedia.org/wiki/Personal_computer#Market_and_sales
US Electric Car Sales In April: Tesla, Volt, & Ford Energi Top List
http://www.forbes.com/sites/bertelschmitt/2016/10/16/for-tesla-electric-car-sales-explode-in-all-the-wrong-places/#19e79f805d39
https://en.wikipedia.org/wiki/U.S._Automobile_Production_Figures
http://www.phonearena.com/news/U.S.-smartphone-adoption-is-faster-than-any-other-major-technology-shift_id30062